View larger version:
Download Original File
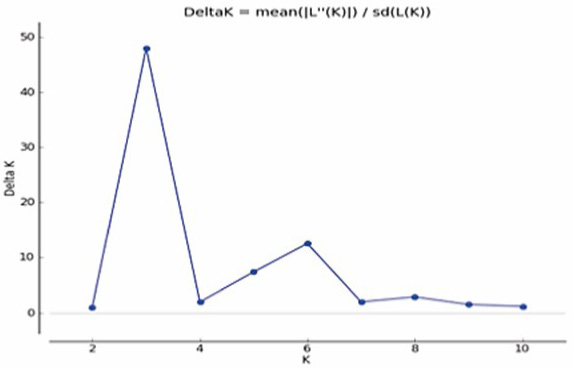
Fig. 4.
Delta K plotted against the number of genetic clusters (K).